
Cloud Cost Optimization for SaaS: Turn Your AWS or Azure Bill Into an Engineering Backlog
Connect every material charge to a workload, an owner and a testable change, then let the bill confirm each saving before you count it.

Tural MamedovChief Executive Officer
Published
Share
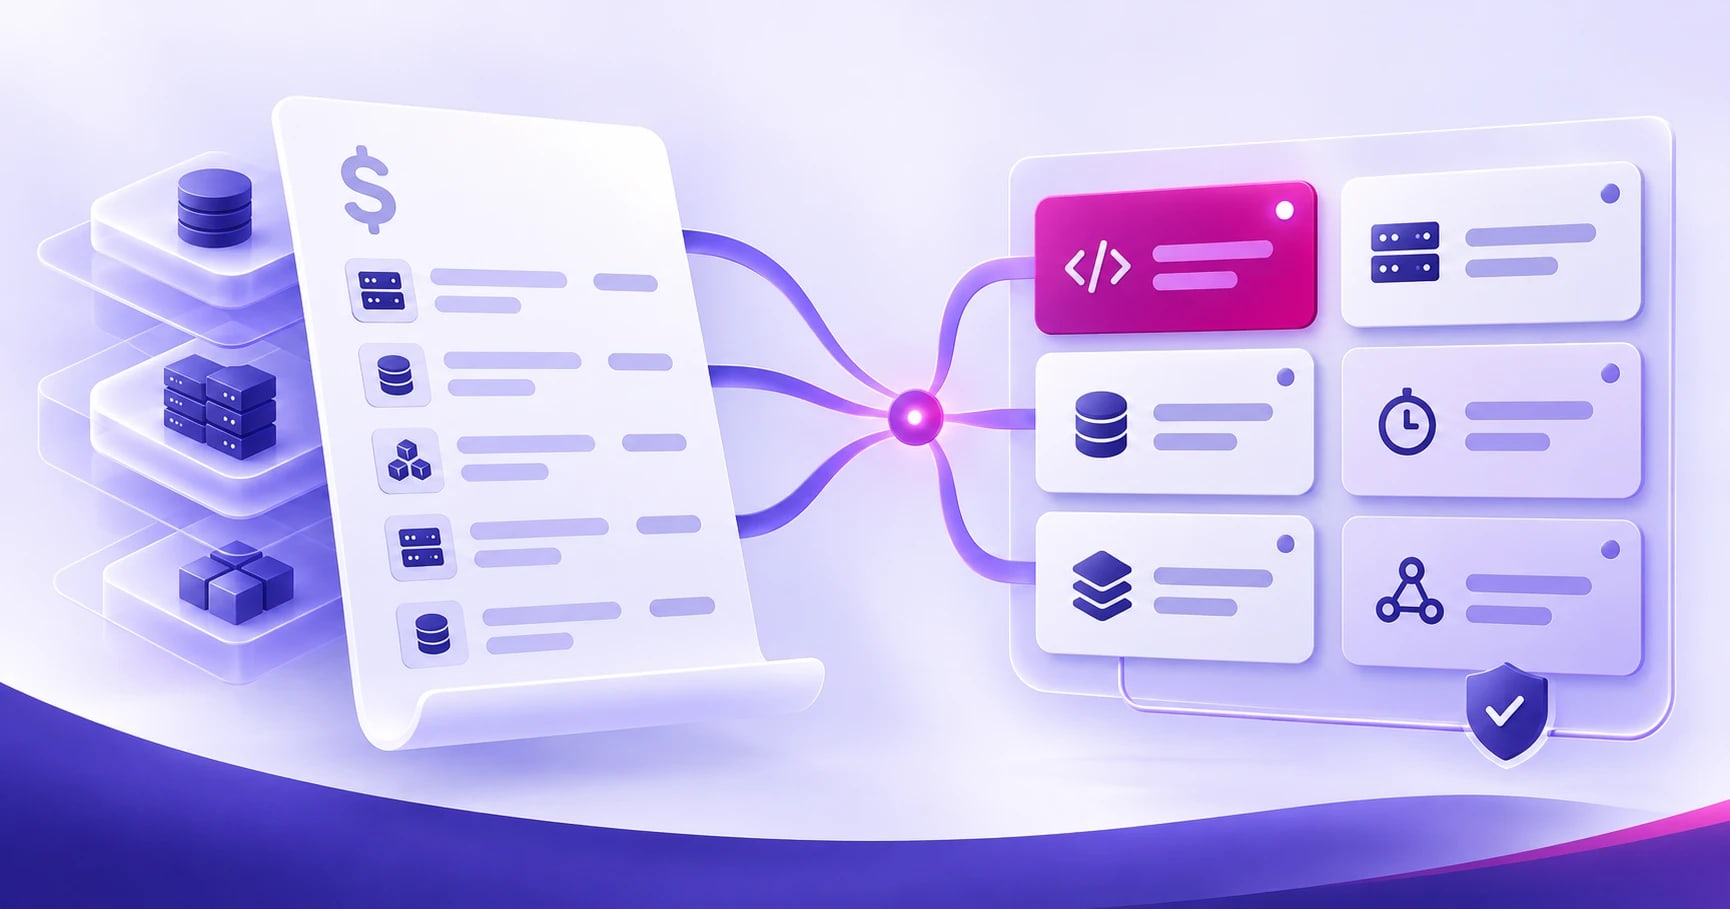
Cloud cost optimization for SaaS works best as an engineering backlog: each material charge on the AWS or Azure bill is traced to a workload and an owner, ranked by the saving you can actually capture, and closed only when the bill confirms it.
Your cloud bill has grown again. Finance wants an explanation. Engineering can point to more customers, another environment, and a database upgrade, but nobody can show which costs were necessary and which can safely come out.
The next step is a backlog that connects each material expense to a workload, an owner, and a testable change. Cloud cost optimization becomes useful when an engineer can pick up a ticket, understand the expected benefit, deploy it safely, and demonstrate what happened afterward.
That work gets harder after the obvious waste is gone. The State of FinOps 2026 reports that mature practitioners see diminishing returns from traditional optimization approaches. For SaaS teams, the implication is practical: finding the next opportunity may require understanding query patterns, tenant behavior, deployment defaults, and data movement.
This guide shows how to move from an AWS or Azure invoice to a prioritized engineering backlog. Start with a trustworthy baseline, investigate the architecture behind the charges, and turn the strongest findings into changes with clear acceptance criteria. Further down, six example fixes show what that looks like in practice: the expected saving, the effort, who owns it and how to prove it worked. For the broader operating model, see unicrew’s guide to cloud financial management and FinOps.
Establish a baseline that survives the next growth spurt
Before setting a reduction target, define the cost boundary and a useful measure of demand. A lower monthly bill can hide falling customer activity, and a higher bill can accompany a more efficient product.
Collect at least a complete billing cycle, then inspect enough history to capture relevant peaks. A quarter may be a useful starting point; annual renewals, seasonal traffic, or infrequent data jobs may require a longer window. Reconcile the analysis with the invoice and explain exclusions such as credits, taxes, support charges, or a one-time migration.
Keep actual billed cost visible for cash planning. Use an amortized view to understand how upfront or recurring commitment costs relate to workload consumption over time. AWS Cost Explorer and Azure Cost Management support these perspectives, although their fields and allocation behavior differ. Document which measure the backlog uses and keep it consistent when comparing before and after.
Include unused commitments in the overall picture. Allocating the utilized benefit to services while omitting the unused portion makes the organization appear more efficient than it is. Finance should be able to reconcile the operational view with total spending, even when the timing of a purchase makes the invoice look different.
Choose units that reflect the product
For a SaaS platform, useful measures might include cost per active tenant, per thousand successful API requests, or per completed processing job. Match the numerator to the denominator: production serving cost belongs with production demand; a development environment needs its own explanation.
Consider a hypothetical platform spending $60,000 a month to complete six million jobs. Its cloud cost is one cent per completed job. If spend rises to $66,000 while completed jobs rise to eight million, unit cost falls to 0.825 cents. That suggests improved efficiency even though the invoice increased. These figures illustrate the method, not cloud prices or an expected result.
Segment further when tenants or jobs differ materially. A document conversion and a complex analytics run should not automatically count as equivalent units. Track important workload classes separately so a changing customer mix does not look like an engineering improvement.
Make ownership visible
Map spend to product, service, environment, and accountable team. Use accounts or subscriptions, resource groups where appropriate, and a small, enforced tag vocabulary. Allocate shared databases, networking, and platform services using a documented rule, such as measured consumption or an agreed proportional split.
Leave an explicit unallocated category. Investigating that category creates a useful first ticket. A precise-looking service dashboard built on unexplained shared charges gives teams the wrong incentive and makes later savings harder to verify.
Check the implementation details early. AWS cost allocation tags require activation. Azure cost allocation rules redistribute costs in reporting without changing the invoice. Tagging and allocation improve accountability; an actual workload or purchasing change is still needed to reduce expenditure.
Read expensive line items as engineering clues
Start with the largest cost categories and the fastest changes. For each, ask what behavior creates the charge, whether that behavior is needed, and which team can change it. The answer often crosses infrastructure and application boundaries.
Compute: Low average utilization can indicate excess capacity, but averages conceal short peaks, memory pressure, and failover requirements. Review traffic, memory, queue depth, startup time, and scaling behavior together. In container platforms, oversized resource requests can also reserve capacity that application usage never needs.
Databases: A larger database may be compensating for inefficient queries, connection churn, excessive polling, or missing indexes. Trace expensive operations before treating an instance change as the whole solution. Review indexes carefully too: they consume storage and add write work. A query improvement may enable a later resize, so record that dependency.
Storage: Separate live customer data, backups, logs, exports, and abandoned artifacts. They have different retention and retrieval requirements. An older object is not necessarily disposable, and a colder tier can introduce retrieval costs or delays. Model the expected access pattern before moving it.
Networking: Follow transfer charges back to actual paths. Repeated full-data exports, cross-region replication, and traffic routed through shared infrastructure deserve inspection. Reducing unnecessary movement can require changing a pipeline or where a job runs. Check availability and data-location constraints before changing that architecture.
Observability and environments: Debug logs left enabled, duplicate telemetry pipelines, permanent preview environments, and full-size staging systems are useful investigation targets. Preserve the audit records and operational signals needed to diagnose incidents. Give temporary environments an owner, an expiry policy, and a way to extend their lifetime deliberately.
These investigations should produce an explanation that a service owner can challenge. “Database spend increased after nightly reporting moved onto the primary” is actionable. “Database costs are high” leaves the important work undone.
Use AWS and Azure recommendations as starting evidence
Native tools help identify candidates and establish a repeatable measurement path. Their recommendations still need application context before they enter a sprint.
AWS examples
Use Cost Explorer to isolate spending by service, account, region, and activated cost allocation tags. Follow material findings into the relevant usage details. A compute trend and a data-transfer trend may have different owners even when they belong to the same product.
AWS Compute Optimizer provides rightsizing preferences that affect recommendations, including lookback and utilization headroom. Check that the analyzed period includes representative demand and that the metrics cover the workload’s limiting resource. A recommendation based on incomplete telemetry should become an investigation ticket first.
For example, an EC2-backed worker fleet might have excess minimum capacity overnight. Test a lower floor against queue age, processing deadlines, and scale-out time. An Amazon RDS finding might instead call for query work before changing capacity. Assign those changes to the platform and application owners who can validate them.
Azure examples
Use Azure Cost Management to analyze subscriptions, resource groups, services, and available tags. Shared-cost allocation should remain visible so product teams can distinguish direct consumption from their share of platform costs.
Azure Advisor’s cost guidance includes shutting down or resizing underused virtual machines. Validate a suggested VM change against memory, disk and network limits, availability requirements, and the application’s busiest period.
An AKS investigation might pair pod resource requests with node utilization and autoscaler behavior. An Azure SQL investigation could trace an expensive reporting workload before changing a service tier. These are different engineering tickets, with different tests. Moving all of them into a generic “reduce Azure spend” task makes ownership and review needlessly difficult.
Rank opportunities by realizable value
Estimate each opportunity against your effective current costs and existing commitments. List prices and a provider’s headline discount are poor substitutes for the amount your organization can actually avoid.
This check matters even when a recommendation displays a savings figure. Azure Advisor explains that its resizing estimates use retail rates and do not account for existing reservations or savings plans. A resize that moves usage outside an existing reservation’s coverage can even increase total cost.
A useful starting score is estimated monthly avoidable cost multiplied by confidence, divided by engineering effort. Use a savings range, a simple confidence category, and effort bands rather than inventing a precise probability or ranking tickets to two decimal places. The score supports a conversation; it cannot price every reliability or security risk.
Apply hard constraints first. A change that would violate an availability objective, retention requirement, or contractual obligation is not ready for implementation. It may need a design investigation, an approved alternative, or no action at all.
Then consider dependencies and payback. A two-day change with a modest recurring benefit can be worth doing before a larger architectural project. The larger project may still belong on the roadmap if it removes a scaling constraint or reduces operational work. Include migration costs, testing, dual-running, and ongoing maintenance in that assessment.
Separate cash savings from freed capacity. Reducing consumption already covered by a commitment may create room for another workload without immediately reducing the invoice. Record that as capacity released or future cost avoided until billing evidence supports a cash-saving claim.
Finally, group overlapping findings. A query fix, database resize, and purchase of discounted capacity cannot each claim the same original spend. Recalculate downstream opportunities after upstream changes, using the revised workload and cost baseline.
Six example fixes for a $60,000 monthly bill
Here is what six fixes could look like for the platform above. The figures are worked for that example; your own bill sets the real ones. Owners are roles to replace with named people, and each check should run across the workload’s real operating cycle.
Schedule eligible development environments
Expected saving: $1,000 to $1,500 a month. Effort: one to three engineering days, low to medium risk. Owner: Platform engineer.
How the saving is worked out: in this example the environments run $2,000 a month in eligible compute that no commitment covers. Scheduling them off for 50 to 75% of their billed hours, at the same rates, saves $1,000 to $1,500 a month, provided the remaining hours need no extra capacity. Storage, networking and anything else that stays billable is excluded, and so is the cost of running the schedule.
What to change: Billing and activity records show selected development environments running through agreed inactive hours. Add scheduled shutdown or deallocation, restart checks, and a documented override. Check which attached resources continue to incur charges.
For Azure VMs, verify the stopped-deallocated state; shutting down the guest operating system alone can leave compute charges running.
How you know it worked: Over two representative weeks, eligible compute runs only during approved windows, scheduled tests still complete, and developers can recover access using the documented procedure. Compare affected resource costs with the original schedule. Keep production and required shared dependencies outside the change.
Right-size a background worker pool
Expected saving: $1,500 to $2,500 a month. Effort: three to five engineering days, medium risk. Owner: Service team with platform support.
What to change: Utilization and queue metrics support testing a smaller instance size or lower minimum count. Choose one variable first and deploy to a controlled subset. Record current scaling limits and configuration for rollback.
How you know it worked: Through a representative peak and recovery test, queue age, job completion deadlines, error rate, and agreed service-level objectives remain within bounds. Cost per completed job improves for comparable demand. Revert if the tested limits are breached.
Remove repeated work from nightly reporting
Expected saving: $2,000 to $4,000 a month, if a later capacity reduction is feasible. Effort: five to ten engineering days, medium risk. Owner: Backend or data engineering lead.
What to change: Query traces and job logs show repeated scans of unchanged data. Test incremental processing or a targeted query improvement, including retries, late-arriving records, and correction handling.
How you know it worked: Outputs reconcile with the existing job across representative datasets, completion meets the reporting deadline, and measured database work falls. Close this fix on functional and resource evidence. Plan the capacity change as a separate follow-up, and count invoice savings only when that change produces them.
Adjust retention for nonessential telemetry
Expected saving: $500 to $1,000 a month. Effort: two to four engineering days, medium risk. Owner: Observability owner with security review.
What to change: Ingestion and storage analysis identifies verbose application logs with no required long-term use. Propose filtering, sampling, or shorter retention for specific streams. Exclude mandated audit records and preserve the signals used by alerts and incident responders.
How you know it worked: Security and service owners approve the policy, incident-response scenarios retain necessary evidence, and representative ingestion and storage costs decline. Validate changes on a limited stream first. Deleted historical records cannot be restored by simply rolling back the configuration.
Eliminate a redundant cross-region export
Expected saving: $800 to $1,400 a month. Effort: four to seven engineering days, medium to high risk. Owner: Data platform lead.
What to change: Transfer records and pipeline logs show a nightly full export to a region where an analytics job reads only changed records. Test incremental transfer, including deletion events and replay. Confirm that the export is separate from required disaster-recovery replication.
How you know it worked: Source and destination reconcile after normal runs, retries, and a simulated interruption. Data freshness and residency requirements remain satisfied, transferred bytes fall for comparable activity, and affected transfer charges decline. Keep a controlled full-resynchronization path and include its occasional cost in the revised estimate.
Evaluate commitments after the workload stabilizes
Expected saving: To be calculated after the earlier changes. Effort: one to two days of analysis, with financial lock-in risk. Owner: Cloud platform lead and finance owner.
What to change: Recalculate eligible steady consumption after cleanup and resizing. Compare commitment options with conservative demand forecasts, existing coverage, and planned migrations. Include a downside case with materially lower usage.
How you know it worked: Engineering and finance agree the eligible baseline, scope, term, utilization assumptions, and approval owner. Purchase authorization remains a separate decision. Track actual utilization and effective savings afterward rather than closing the work on the provider’s recommendation alone.
Do not add these examples into a promised total. Reporting improvements may change the worker or database baseline, and existing commitments may absorb reduced usage. Keep one savings ledger that records dependencies, implementation dates, measurement windows, and which benefits have been verified.
For each completed change, preserve the billing query, relevant resource identifiers, before-and-after configuration, and demand measure. Assign a verification date rather than assuming the next invoice will settle every question. Billing lag, partial-month deployment, and seasonal traffic can all delay a defensible conclusion.
Change capacity safely before buying commitments
Sequence matters. Remove verified waste, improve inefficient work, right-size the remaining workload, and then evaluate commitments against the stable baseline. Microsoft’s guidance on calculating total cost savings explicitly warns about overlapping recommendations and orders rightsizing or shutdown before reservations and savings plans.
AWS Savings Plans exchange a consistent hourly spending commitment for discounted eligible usage over a one- or three-year term. Azure savings plans for compute also involve an hourly commitment over one or three years. Eligibility and flexibility differ across products. Review the specific plan or reservation against expected services, regions, and future architecture.
An hourly commitment deserves hourly analysis. A high monthly average can conceal low overnight consumption that leaves part of a commitment unused. Planned growth belongs in a forecast with uncertainty, rather than being treated as guaranteed coverage.
For technical changes, agree guardrails before rollout. Capture the baseline for latency, errors, availability, saturation, and business-specific completion deadlines. Define canary scope, observation time, rollback triggers, and the person authorized to revert. Use infrastructure as code where possible so the change and its reversal are reviewable.
Retain required redundancy, security controls, and disaster-recovery capability. Test restore and failover assumptions when a proposed saving touches them. Reducing a standby footprint can change recovery time; reducing backup retention changes recoverability. Those consequences need explicit evaluation alongside the cost estimate.
Make the first 90 days deliver evidence
Run the first 90 days in three stages: establish ownership and ship reversible changes, address the application causes, then protect the gains. Each stage should end with verified results, not only a longer backlog.
Days 1 to 30: establish ownership and ship reversible changes
Reconcile the baseline, select product-level unit costs, and assign owners to the largest charges. Choose a few well-understood opportunities with manageable blast radius. Implement them through normal review and deployment processes, then measure the result.
End the month with a ranked backlog and a small set of verified outcomes. Record inconclusive experiments too. A resize that fails its latency guardrail provides useful evidence about the workload and prevents someone repeating the same unsafe recommendation next quarter.
Days 31 to 60: address the application causes
Work through query improvements, job scheduling, data movement, and resource-request changes. Split investigations from implementation when the cause is uncertain. Put prerequisite work ahead of downstream capacity changes, and reserve engineering time for both.
Review results with finance and service owners using the same cost definitions. Compare equivalent demand periods and explain traffic growth, workload-mix changes, deployment overlap, and pricing changes. Update estimates when evidence changes instead of preserving the original savings target for appearances.
Days 61 to 90: protect the gains
Reassess commitments using the new baseline. Add practical controls such as environment expiry, required ownership tags, reviewed resource defaults, and alerts for unusual cost or unit-cost movement. Give each alert an owner and a response path.
Keep a short recurring review focused on decisions: which experiment can ship, which dependency is blocked, and which benefit has been verified? Maintain absolute spend and unit cost together. Growing revenue or customer activity can justify higher expenditure while still leaving specific inefficiencies worth fixing.
Know when an outside review will help
An independent review is useful when material costs remain unexplained, ownership has been lost through team changes, or engineering lacks time to connect billing evidence with architecture. If you already know the changes and have the capacity to deliver them, start with the backlog.
In one US B2B SaaS engagement, the client credits unicrew’s knowledge of AWS and Heroku with helping it streamline the platform and cut its AWS costs by 30% or more.
unicrew’s Cloud Cost and AI-Readiness Audit examines your actual AWS or Azure bill and produces a teardown and prioritized savings plan. If your only question is cost, we run the teardown alone and scope the fee to that. Scope and fee are agreed in writing before anything starts, an NDA comes before any access, and the audit works from read-only, least-privilege access agreed with your technical contact. Implementation can stay with your team or be addressed through a separate cloud consulting or DevOps consulting engagement.
Bring the bill, the architecture, and the constraints your team must protect. The useful outcome is a set of decisions your engineers can act on, with enough evidence to tell whether each change worked.
Frequently asked questions
Cloud cost optimization for SaaS is the work of lowering what a software platform pays AWS or Azure for the demand it serves, without weakening reliability, security or data obligations. It combines usage changes, such as rightsizing, scheduling idle environments, storage tiering and cutting data transfer, with rate changes, such as Savings Plans or reservations bought against a stable baseline. In practice it means tracing each material charge to a workload and an owner, tracking cost per tenant, request or job alongside total spend, ranking changes by the saving you can realistically capture, and verifying each result against the bill.
Divide the cloud cost of a defined boundary by a demand measure that reflects the product, such as active tenants, thousands of successful API requests or completed processing jobs, and match the two: production cost belongs with production demand. A hypothetical platform spending $60,000 a month to complete six million jobs pays one cent per job. If spend rises to $66,000 while completed jobs rise to eight million, unit cost falls to 0.825 cents, an efficiency gain even though the invoice grew.
After the workload has stabilized. Remove verified waste, fix inefficient work and right-size what remains, then size the commitment against that new baseline using hourly consumption, existing coverage and a conservative demand forecast. Microsoft's Azure Advisor guidance puts rightsizing and shutdown before reservation and savings plan purchases, because each step changes the usage the next one is calculated on.
Azure Advisor bases its rightsizing and shutdown savings on retail rates and does not account for discounts on your account or for reservations and savings plans you already hold, so the listed saving can be higher than what you will actually see. Microsoft notes that following a cross-series resize can even increase cost, depending on which reservations you have bought. Estimate each change against your effective rates and current commitments.
For each change, record the billing query, the resource identifiers, the configuration before and after, and the demand measure, and set a verification date that covers the workload's real operating cycle. Compare equivalent demand periods, separate cash savings from capacity freed inside an existing commitment, and keep one savings ledger so overlapping changes, such as a query fix and a database resize, never claim the same spend twice.